
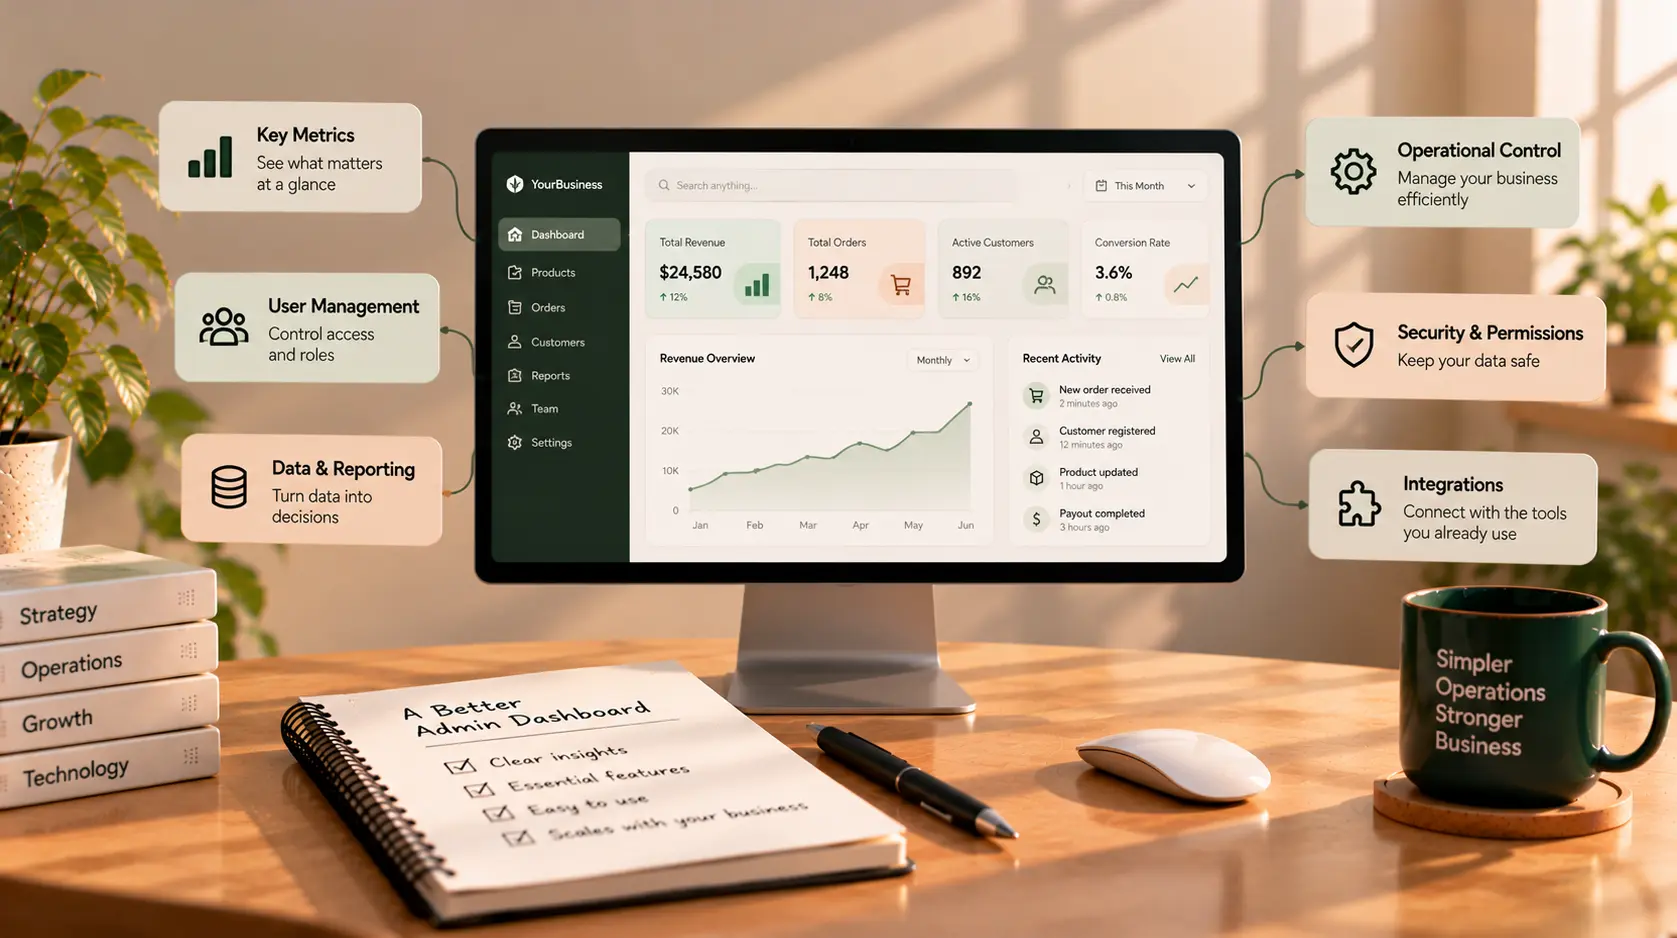
Admin Dashboards: What a Business Actually Needs From One
When a business starts growing, important information tends to spread across different places. Orders live in one system, customer details in another, staff tasks in a spreadsheet, and performance reports in yet another tool. Managers spend time switching between screens or asking someone to pull the latest numbers.
An admin dashboard can bring important information and actions into one place. But a dashboard is not automatically useful just because it contains charts, colourful cards, and a long navigation menu. If staff still rely on spreadsheets to understand what is happening—or cannot complete routine tasks without asking for help—the dashboard may be displaying data without solving the underlying problem.
The right admin dashboard for a business is designed around the decisions people need to make and the work they need to complete. It helps users understand what needs attention, access the right records, and take the next step without unnecessary friction.
This guide explains what a business admin dashboard should include, which features are worth prioritising, and how to decide whether your business needs a custom solution.
What Is a Business Admin Dashboard?
A business admin dashboard is a central interface where authorised users can monitor operations, manage records, review performance, and complete administrative tasks.
Depending on the business, it may support activities such as:
- Managing customers, leads, orders, bookings, or projects
- Reviewing sales, revenue, or operational metrics
- Assigning work and tracking task status
- Managing staff accounts and permissions
- Approving requests or updating records
- Exporting reports and investigating exceptions
- Configuring business settings and integrations
The dashboard is often part of a larger web application. It may connect to a CRM, inventory system, billing service, booking platform, or internal database.
The key distinction is that a dashboard should help users act, not just observe. A chart showing overdue orders is useful; a clear route to review and resolve those orders is even more useful.
Start With the People Who Will Use It
Before choosing features or designing screens, identify the different users and the work they need to do. A business owner, operations manager, finance employee, and customer support agent rarely need the same information.
| User | What they may need |
|---|---|
| Business owner | High-level performance, important exceptions, and overall business health |
| Operations manager | Work queues, overdue tasks, bottlenecks, and team workload |
| Sales team | Leads, pipeline stages, follow-ups, and conversion activity |
| Finance team | Invoices, payments, outstanding balances, and reconciliations |
| Support team | Customer history, open issues, and response status |
| Administrator | User accounts, roles, configuration, and audit history |
These are examples, not a universal feature list. A small service business may need only customer records, appointments, invoices, and staff access. A larger operation may need multiple work queues, approval paths, and more detailed reporting.
A practical discovery question is: What are the three to five things each user needs to understand or do when they open the dashboard? Start there before adding secondary features.
The Core Features Most Businesses Should Consider
1. A Useful Overview of Business Activity
The overview should answer the questions users commonly ask first. Depending on the business, that might include new enquiries, orders awaiting action, upcoming appointments, overdue invoices, or tasks approaching their deadlines.
Keep the initial view focused. A screen full of metrics can make it harder to identify the one item that needs attention. Each metric should have a clear definition, a relevant time period, and a reason to be there.
For example, a sales dashboard might show:
- New leads this month
- Deals currently in progress
- Follow-ups due today
- Deals won during the selected period
- Leads that have not received a response
A finance dashboard would have different priorities. Choose metrics based on the decisions users actually make rather than copying a generic dashboard layout.
2. Clear Navigation and Search
Users should be able to find common sections and records without memorising the system. Use familiar labels, group related functions, and make frequently used actions easy to locate.
Search is especially valuable when staff need to find a particular customer, order, invoice, booking, or project. Where appropriate, allow users to filter results by status, date, owner, category, or other meaningful fields.
For larger datasets, include pagination or another predictable way to browse results. Show useful empty states too: if a search returns nothing, explain that no matching records were found and offer a way to adjust the search.
3. Record Management That Matches the Workflow
Many admin dashboards exist because the business needs a reliable way to create, view, update, and sometimes archive its records.
The records might be customers, products, employees, appointments, projects, subscriptions, or service requests. For each type, define:
- Which fields are essential
- Which fields can be edited and by whom
- Which status changes are allowed
- Whether records need approval
- What should happen when a record is archived or deleted
- Whether a change needs to be logged
Avoid making every field editable by every user. Some changes may affect billing, reporting, customer communication, or compliance. Add confirmation steps for destructive actions and make important status changes clear.
4. Role-Based Access and Permissions
Not everyone in a business should be able to see or change everything. A staff member may need to update a booking but not manage administrator accounts. A finance employee may need invoice access without permission to edit customer-support settings.
A role-based permissions model can define what different groups can view and do. Common roles might include owner, administrator, manager, staff member, and read-only user, but the right structure depends on the organisation.
Plan permissions at the beginning rather than treating them as a final cosmetic setting. Access should be enforced by the application and its backend—not merely by hiding buttons in the interface.
For sensitive systems, also consider multi-factor authentication, secure session handling, appropriate password policies, and audit logs. The security controls should match the sensitivity of the information and the risks of the business.
5. Reports That Help People Make Decisions
Reports are useful when they answer a real question. Examples include sales by period, outstanding invoices, staff workload, appointment completion, inventory exceptions, or customer acquisition trends.
Each report should make it clear:
- What is being measured
- Which date range or filters are applied
- How the metric is calculated, where that may be unclear
- When the data was last updated
- Whether users can export or drill into the underlying records
Choose charts based on the question. Bar charts are often useful for comparing categories, while line charts help show trends over time. Detailed records may be easier to inspect in a table than in a chart.
Avoid using colour as the only way to communicate status. Pair colours with labels or icons, provide readable contrast, and make the dashboard usable on different screen sizes. The Oregon Health Authority's accessible data visualisation guide offers practical guidance on labels, summaries, colour, navigation, and testing.
6. Alerts, Tasks, and Approvals
A dashboard becomes more operationally useful when it helps people identify and act on exceptions.
Depending on your workflows, it might highlight:
- Orders that have not shipped on time
- Enquiries awaiting a response
- Invoices approaching their due date
- Requests waiting for approval
- Tasks that have passed their deadline
- Records with missing or inconsistent information
Make alerts actionable. Explain what happened, why it matters, and what the user can do next. Too many low-value notifications create noise, so define which conditions genuinely require attention and who should receive them.
If the business has approval workflows, document the stages, responsible roles, and rules for rejection or resubmission. A visible status and clear next step can prevent requests from becoming stuck.
7. Integrations With Existing Business Tools
A dashboard is only as reliable as the information and processes behind it. If customer data, payments, bookings, or inventory are managed in other systems, decide which system is the source of truth and how updates should move between them.
Possible integrations include:
- CRM and lead management tools
- Accounting and invoicing software
- Payment providers
- Email or messaging services
- Booking and calendar systems
- Inventory or fulfilment platforms
- Analytics and reporting tools
Not every integration needs to be built immediately. Prioritise integrations that remove repetitive manual work, reduce data-entry errors, or make a critical workflow possible.
For each integration, define how failures will be handled. Users should not be left guessing whether a payment, message, or record update succeeded. Where relevant, show a status, provide a retry path, and log enough information for the team to investigate.
What Should You Avoid Putting on the Dashboard?
More features do not automatically create a better product. Common sources of unnecessary complexity include:
- Metrics nobody uses: If a number does not inform a decision, consider removing it.
- Charts without context: A figure without a time period, definition, or comparison can be misleading.
- Duplicate data entry: Avoid asking users to enter information that can safely be reused from an existing record.
- Too many notifications: Prioritise important exceptions rather than highlighting every event.
- Unclear permissions: Users should understand which actions they can take, and the system should enforce those rules.
- Overloaded navigation: Group related sections and keep the most common tasks easy to find.
- Unexplained errors: When an action fails, provide a useful message and a reasonable next step.
- Features added “just in case”: Build around confirmed needs and add complexity when there is a clear reason.
A strong dashboard is not the one with the most information. It is the one that helps the right person find the right information and take the right action with minimal effort. Nielsen Norman Group describes dashboards as at-a-glance views designed to help users understand information quickly and act on it (Dashboards: Making Charts and Graphs Easier to Understand).
Build vs. Buy: Does Your Business Need a Custom Dashboard?
You may not need custom software at all. The decision depends on how closely existing tools fit your processes, what they cost over time, and how much flexibility your business needs.
| Option | Best suited for | Main consideration |
|---|---|---|
| Existing software with built-in admin tools | Common workflows and standard processes | You may need to adapt your process to the product |
| No-code or low-code tools | Straightforward internal workflows and prototypes | Check limits around permissions, integrations, data, and future changes |
| Custom business dashboard | Distinct workflows, multiple systems, or specific access rules | Requires development, testing, security, and ongoing maintenance |
A custom dashboard may be worth exploring when staff repeatedly move data between systems, existing tools cannot represent an important workflow, permissions need to be tailored, or management lacks a reliable view of operations.
However, custom development also creates responsibilities. Someone must maintain the application, update dependencies, monitor integrations, manage access, back up data, and respond to issues. Include those ongoing costs in your decision rather than considering only the initial build.
A useful starting point is to document the workflow that is causing the most friction, then compare the cost and limitations of available tools against the value of improving it.
How to Plan a Business Admin Dashboard Before Development
A short planning process can prevent a lot of rework.
Step 1: List the problems to solve
Describe the current pain points in business terms: reports take hours to prepare, customer information is duplicated, approvals get lost, or staff cannot see which requests are overdue.
Step 2: Map the current workflow
Write down what happens from beginning to end, who is responsible at each stage, which systems are involved, and where delays or errors occur.
Step 3: Define users and permissions
List the roles that will use the dashboard and what each role needs to view, create, update, approve, export, or administer.
Step 4: Choose the essential metrics
Select a small set of indicators that help users make decisions. Define the calculation, data source, time period, and owner of each metric.
Step 5: Prioritise a first release
Separate must-have features from improvements that can wait. A focused first version is easier to test with real users than a large system built around assumptions.
Step 6: Test with realistic tasks
Ask representative users to complete common tasks using realistic sample data. Observe where they hesitate, make mistakes, or need assistance. Test empty states, loading states, permission restrictions, validation errors, and failed integrations—not only the ideal scenario.
Step 7: Plan for ongoing ownership
Decide who will maintain the dashboard, handle user access, review errors, manage backups, and prioritise future changes. A dashboard is a working business system, not a one-time design deliverable.
A Practical Checklist Before You Approve the Project
Use this checklist when evaluating an existing product or discussing a custom admin dashboard with a developer.
- The business problems and intended outcomes are documented.
- Each user role and its permissions are defined.
- The most important records and workflows are identified.
- The key metrics have clear definitions and reliable data sources.
- Search, filters, and common actions are easy to find.
- Reports show relevant context, such as date range and update time.
- Important errors and integration failures are visible and understandable.
- Sensitive actions and data are protected appropriately.
- The interface is tested for accessibility and smaller screens.
- The first release has a clear scope and acceptance criteria.
- Maintenance, support, and future changes have an owner.
Final Thoughts
A business admin dashboard should make everyday operations easier to understand and manage. That usually means a clear overview, fast access to records, sensible permissions, useful reports, and workflows that help people resolve issues instead of merely displaying them.
Start with the people who will use the system and the decisions they need to make. Build the smallest set of features that solves a real operational problem, test it with realistic tasks, and expand it when actual usage reveals a need.
If you're planning a custom dashboard or business web application, get in touch to discuss the workflow, requirements, and technical approach before development begins.